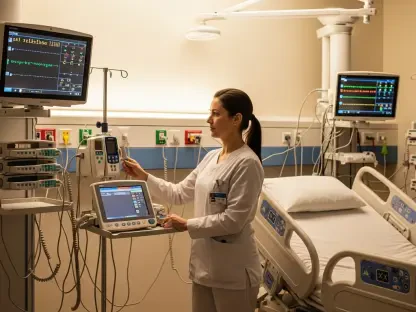

Today we’re joined by Ivan Kairatov, a biopharma expert whose work at the intersection of neuroscience and artificial intelligence is paving the way for revolutionary new diagnostic tools. We’ll be discussing a groundbreaking deep learning model that uses affordable, non-invasive EEG technology to detect and differentiate between Alzheimer’s disease and Frontotemporal dementia with unprecedented accuracy. This conversation will explore how the model’s unique architecture interprets complex brainwave data, the practical steps that make it so precise, and its potential to provide clinicians with real-time insights into disease severity, ultimately transforming how we diagnose and manage dementia.
Your model combines convolutional neural networks and LSTMs to achieve over 90% accuracy in detecting dementia. Could you walk us through how this dual approach identifies both the spatial and temporal brainwave patterns that previous EEG-based machine learning applications have struggled to interpret?
What makes our approach so effective is that we’re essentially teaching the model to see the brain’s activity in four dimensions: not just where the signals are coming from, but how they change and evolve over time. The convolutional neural networks, or CNNs, are fantastic at spatial recognition. They look at the EEG data like a map of the brain, identifying which regions are showing abnormal activity. The LSTMs, or long short-term memory networks, then analyze the temporal flow—the rhythm and sequence of these brainwaves. By merging these two capabilities, we can detect the incredibly subtle, complex patterns that are hallmarks of Alzheimer’s and FTD. It’s this fusion of ‘where’ and ‘when’ that allows us to move past the noisy, inconsistent data that has limited older EEG analysis methods and achieve such high accuracy.
The study found slow delta waves were a key biomarker for both AD and FTD, yet AD also showed disruption in other bands like beta. How does your model weigh these different signals to distinguish between the two diseases, especially when their symptoms can overlap so closely?
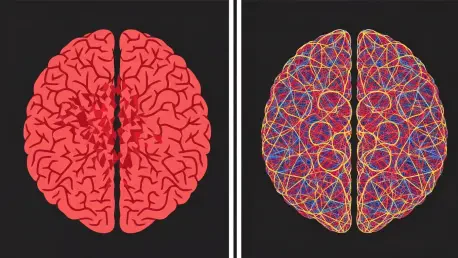
That’s the core of the diagnostic challenge, and it’s where the model’s sophistication truly shines. While both diseases show prominent slow delta wave activity, particularly in the frontal and central brain regions, the model learns to look for the “signature” of the disruption. For Frontotemporal dementia, the abnormalities are more localized, primarily concentrated in those frontal areas. With Alzheimer’s, however, the damage is far more widespread. The model detects that the disruption isn’t just in the delta waves; it also sees significant abnormalities in other frequency bands, like the beta band, and across a wider geography of the brain, including the parietal and temporal regions. It’s this broader, more extensive pattern of brain damage in AD that the model weighs heavily, allowing it to differentiate from the more focused impact of FTD.
You used a two-stage design that significantly boosted specificity in telling AD and FTD apart, from 26% to 65%. Could you explain the practical steps of this process and why separating healthy individuals first was so crucial for improving the model’s diagnostic precision?
The two-stage design was a critical breakthrough for us. Initially, when we tried to make the model distinguish between three groups at once—healthy, AD, and FTD—it struggled, especially with telling the two diseases apart. The specificity was a dismal 26%. So, we redesigned the process. In the first stage, the model performs a simpler task: it just separates the cognitively normal participants from anyone with dementia. It achieved over 90% accuracy here. By filtering out the healthy individuals first, we removed a major source of variability. The second stage could then focus entirely on the much harder job of differentiating AD from FTD, using a dataset that was already pre-screened for dementia. This focused approach is what allowed us to more than double our specificity and achieve an overall accuracy of 84% in telling them apart.
Beyond detection, your model predicts disease severity with less than 15.5% relative error for FTD. What specific features in the EEG data allow the model to make this calculation, and how might clinicians use this real-time severity score to track disease progression?
The ability to measure severity comes from the same deep analysis of brainwave patterns. The model doesn’t just see the presence of a biomarker; it quantifies its intensity and spread. For instance, the degree of disruption in brain activity—how widespread it is, how much it deviates from normal patterns—correlates directly with the patient’s cognitive scores and the clinical stage of the disease. For a clinician, this is a game-changer. Instead of relying solely on periodic, and often subjective, cognitive evaluations, they get an objective, real-time score. They could use this tool to monitor a patient month by month, seeing if a treatment is slowing the progression or if the disease is accelerating. It moves diagnosis from a static snapshot to a dynamic, continuous process, offering a much more complete picture of the patient’s condition.
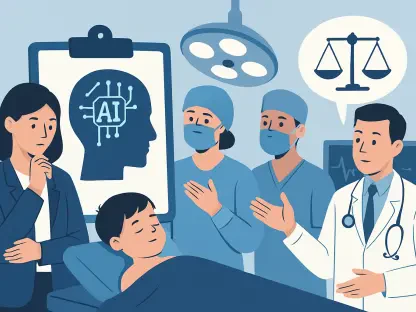
You mention using Grad-CAM to help clinicians understand the model’s decisions. Can you describe an instance where this visual tool could clarify a diagnosis by highlighting the specific brain regions and frequencies that led the model to differentiate a case of FTD from AD?
Imagine a clinician is looking at the case of a 55-year-old patient with behavioral changes, a classic symptom overlap between AD and FTD. The model’s output says “FTD.” Naturally, the clinician wants to know why. With Grad-CAM, they can see a visualization of the patient’s brain activity, with a “heat map” showing exactly what the AI focused on. In this scenario, the map would brightly illuminate the frontal and central regions, showing intense, slow delta wave patterns there. Crucially, the parietal and temporal lobes would remain cool, with no significant activity highlighted in the beta frequency band. This visual evidence directly supports the FTD diagnosis by showing the localized nature of the brain disruption, in stark contrast to the widespread pattern the clinician would expect to see in a case of Alzheimer’s. It transforms the AI from a “black box” into a transparent and trustworthy diagnostic partner.
What is your forecast for the widespread clinical adoption of affordable, AI-powered diagnostic tools like this one? What are the biggest hurdles—technological, regulatory, or clinical—that need to be overcome to make this a standard part of dementia care in the next decade?
I am incredibly optimistic, but we must be realistic about the path ahead. The potential to bring a non-invasive, inexpensive, and highly accurate diagnostic tool into every neurology clinic is immense. However, the hurdles are significant. On the regulatory front, we need to navigate the rigorous approval processes to prove the model is not only accurate but also safe and reliable across diverse populations. Clinically, there’s a challenge of integration—fitting this into established diagnostic workflows and ensuring physicians are trained and comfortable trusting an AI’s recommendation. Technologically, we must continue to refine the model and ensure its performance is consistent across different EEG hardware. Overcoming these barriers will require a concerted effort between engineers, neuroscientists, and regulators. But if we succeed, I forecast that within a decade, these AI-powered EEG systems will become a standard, first-line tool for dementia screening, leading to earlier detection and more personalized care that can truly improve millions of lives.